The Curated News Hub
Your daily source for diverse news and insights.
Seeing is Believing: Transforming Data into Insights
Unlock the power of data! Discover how to turn raw numbers into eye-opening insights that drive decisions and spark innovation.
The Power of Visualization: How Data Becomes Insight
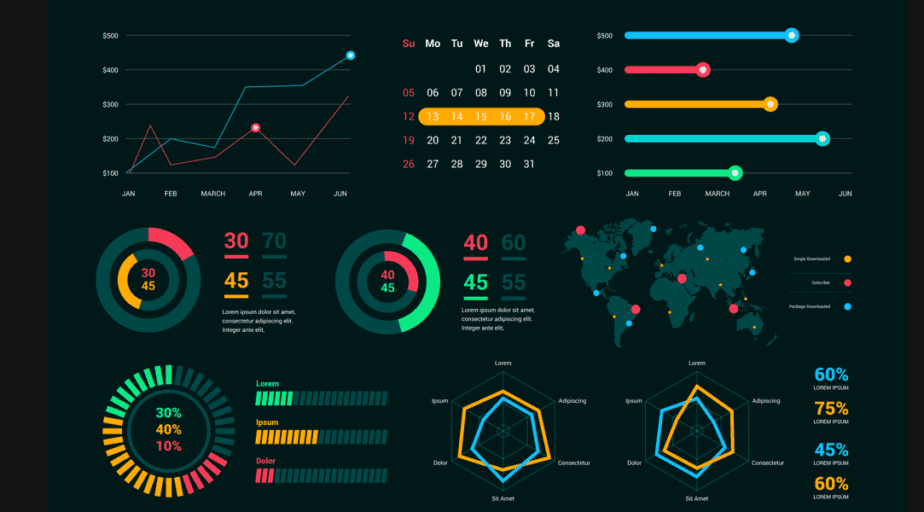
The power of visualization lies in its ability to transform raw data into meaningful insights. By utilizing various graphical representations, such as charts, graphs, and infographics, we can comprehend complex datasets at a glance. This process not only enhances our understanding but also accelerates decision-making processes across various fields, including business, healthcare, and education. Visualization allows stakeholders to identify trends, patterns, and anomalies that may be hidden within the numbers, making data-driven strategies more effective.
Moreover, effective data visualization enables collaboration among team members by presenting information in a clear and interactive format. As a result, teams can engage in discussions that harness the collective intelligence of diverse perspectives. To maximize the insight gleaned from data, it is essential to use appropriate visual tools, such as:
- Bar charts for comparing quantities
- Line graphs to show trends over time
- Heat maps to display data density

Unlocking Hidden Patterns: Key Techniques for Data Interpretation
Unlocking Hidden Patterns in data interpretation is crucial for uncovering insights that can drive informed decision-making. Analysts often rely on techniques such as data visualization, which utilizes graphical representations to reveal trends and anomalies that might be otherwise overlooked. By employing methods like heat maps or scatter plots, one can effectively communicate complex data sets and allow for quicker recognition of significant relationships. Moreover, utilizing statistical analysis techniques, such as regression analysis, can further aid in understanding underlying correlations within the data.
Another pivotal technique for unlocking hidden patterns is clustering analysis. This method segments data into distinct groups based on shared characteristics, enabling the identification of natural structures within the dataset. Methods like k-means clustering or hierarchical clustering are commonly used to facilitate this process. Furthermore, combining these techniques with machine learning algorithms can enhance predictive accuracy and enable real-time insights. By mastering these key techniques, analysts can truly harness the power of data and unlock valuable patterns that inform strategic initiatives.
How to Choose the Right Data Visualization Tools for Your Insights
Choosing the right data visualization tools is essential for transforming raw data into insightful visuals that drive decision-making. Begin by evaluating the specific needs of your project; consider factors such as the type of data you are working with and your audience's preferences. For instance, interactive tools like Tableau or Power BI may be ideal for engaging stakeholders, while simpler options like Google Charts could suffice for basic presentations. Additionally, think about the level of customization you require, as some tools offer advanced capabilities to tailor visuals, while others are more template-based.
After pinpointing your requirements, it's crucial to assess the usability and accessibility of the chosen data visualization software. Take into account the learning curve associated with each tool, as well as the community support and resources available for users. A well-documented tool with a robust community can significantly reduce the time it takes to become proficient. Finally, cost considerations cannot be overlooked—evaluate your budget and explore options, from free tools like Datawrapper to premium solutions that may offer extensive features but come at a higher price point.